|
|
 Originally Posted by MadMojoMonkey

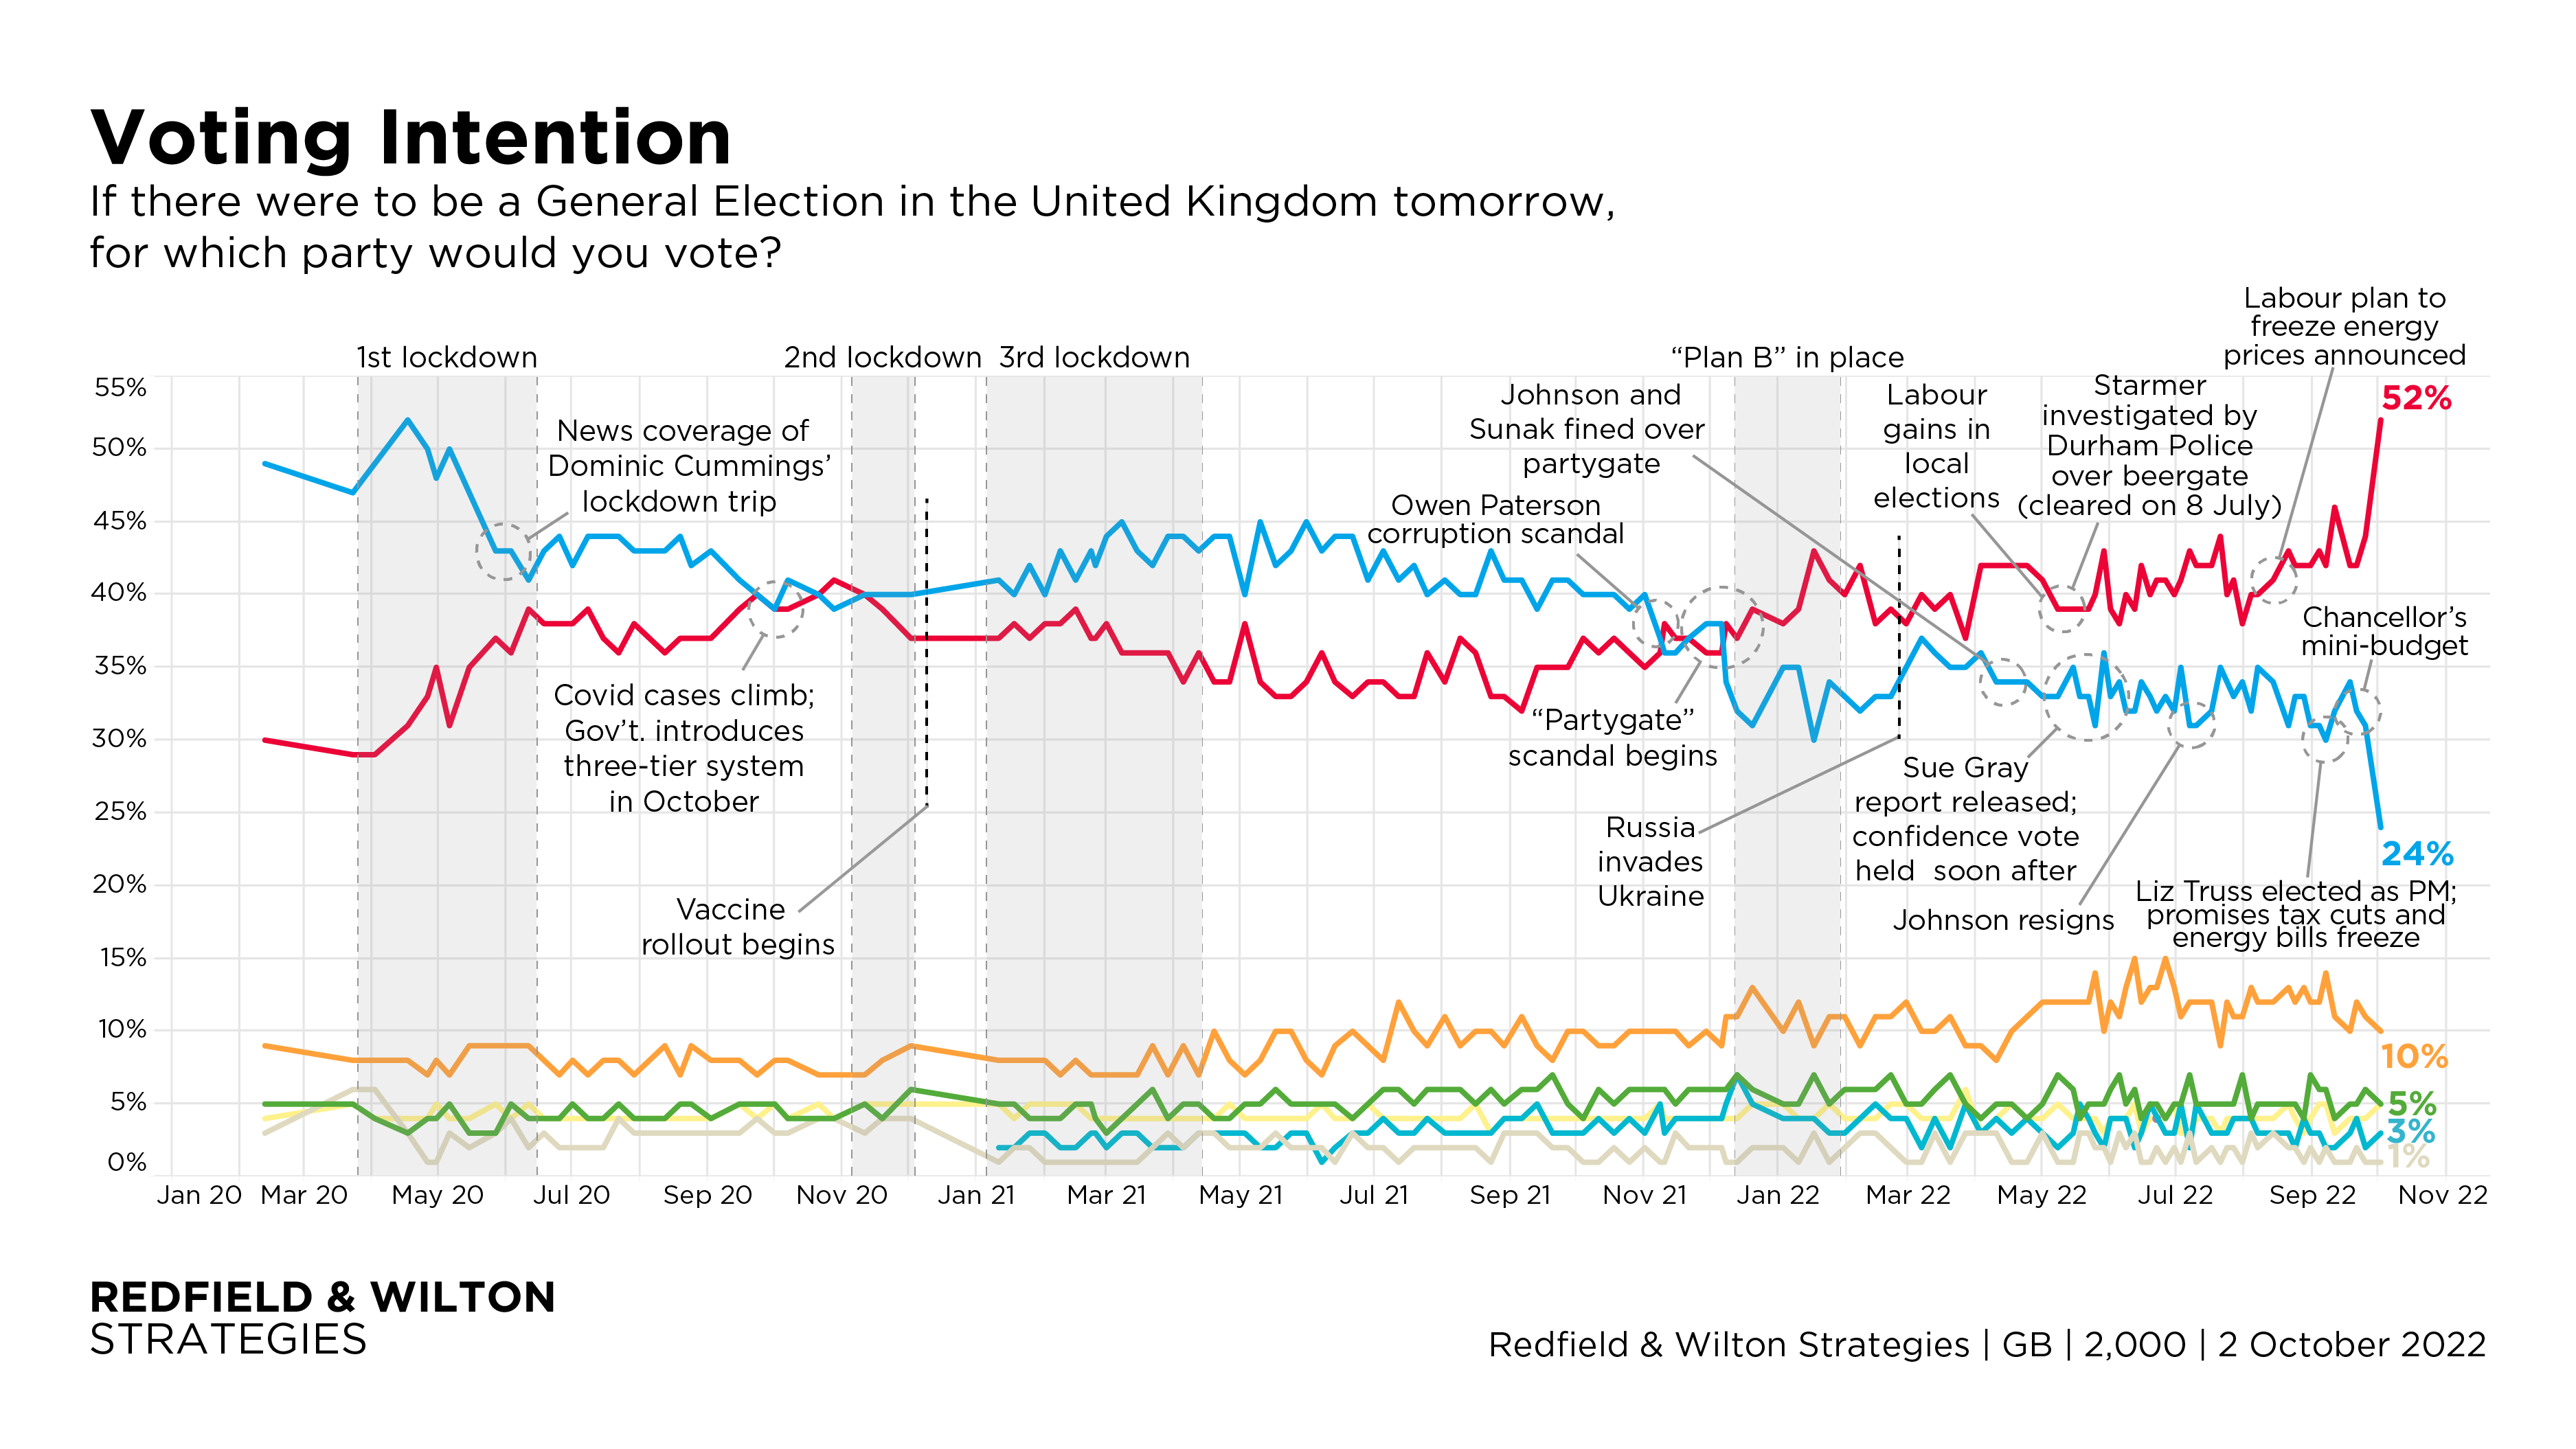
Lol. That graph suggest something like 95% of voters would vote.
I call BS.
Either it's a severely limited sample of the constituency limited to people who always vote, or the people who answered were blatantly lying by saying they would vote at all.
It's 100% of people who gave a clear answer; there's another line there around 4%
Originally Posted by MadMojoMonkey
Also... lack of a legend to say what color is what is just bad graphing, mmmkay?
They also have a value missing for yellow. Amateurs. But don't worry I'll help you out.
Labour: Woke, libtard, commie union supporting red
Tories: True, patriotic, dingy-sinking, Europe-leaving blue
LibDems: Slightly less woke, but still kinda libtard orange
Green Party: Broccoli eating, tree hugging green
Scottish National Party: Traitorous, haggis eating yellow
Don't even know who the ones at 3% and 1% are, but they're losers. Bigly.
|


 Reply With Quote