|
|
 Originally Posted by badgers
Yeah most of what I'm saying is just stuff I've picked up from browsing and worked out, I haven't seen any explanation threads anywhere.
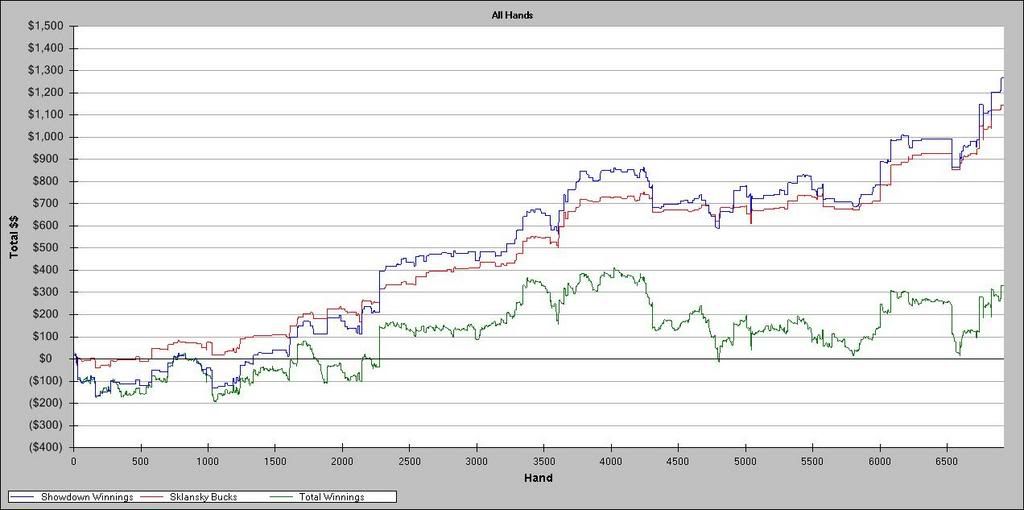
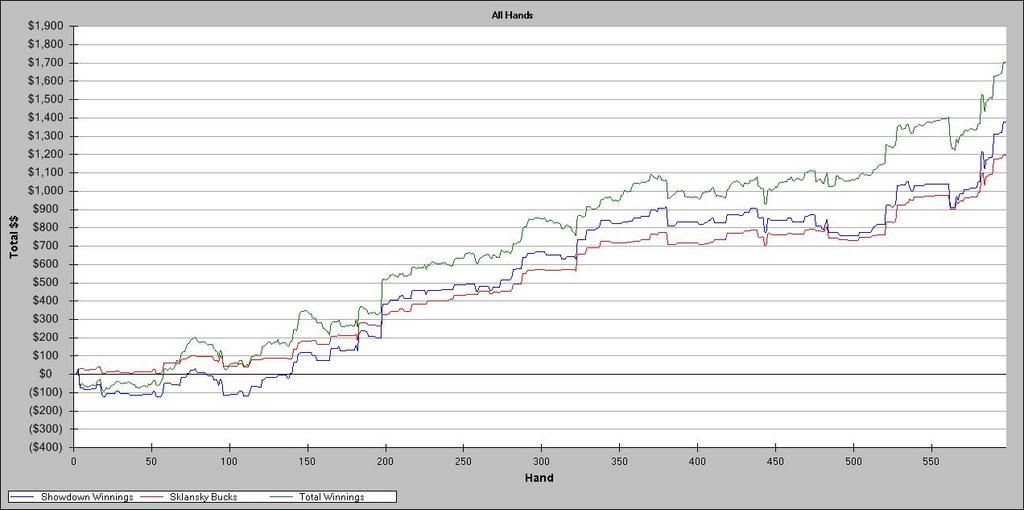
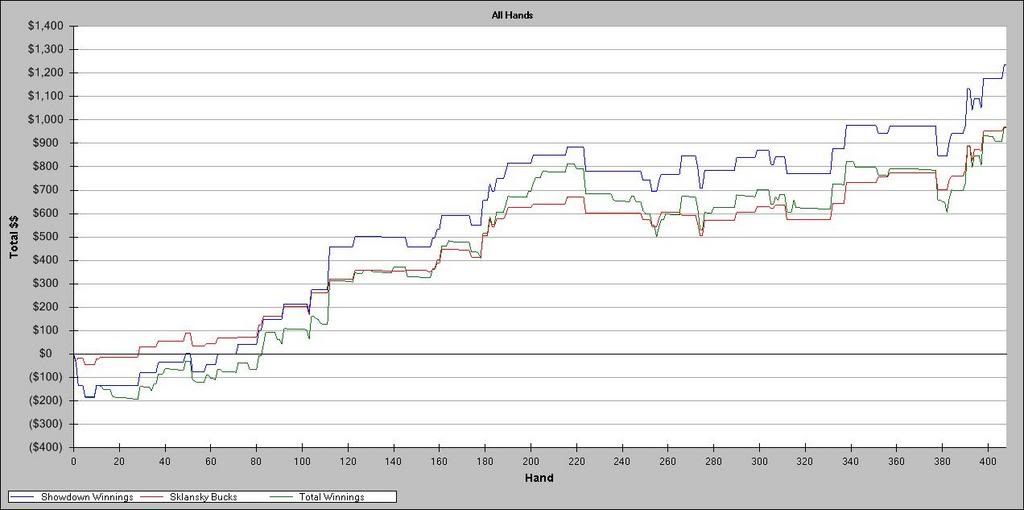
If the green line is below the others, you are losing a lot of pots that have not gone to showdown, be that through cbets getting raised, bet flop/turn/ river whatever and getting raised/ bet on later streets. I think it's pretty normal to have the green line below the others if you have a high win at showdown % because you will make most of your money in pots that go to showdown.
I guess if your green line is closer you could be being less aggro when you don't have a hand ie. lower cbet % etc, or you are running goot, or your win showdown % is going down.
I don't think I've ever seen a good player say that they have a lot of belief that you can get good analysis of your game from these graphs though. Maybe if you couple the graphs with PT stats you can get something, but I think the main use is to see how well you're running and it's debatable that it even shows that...
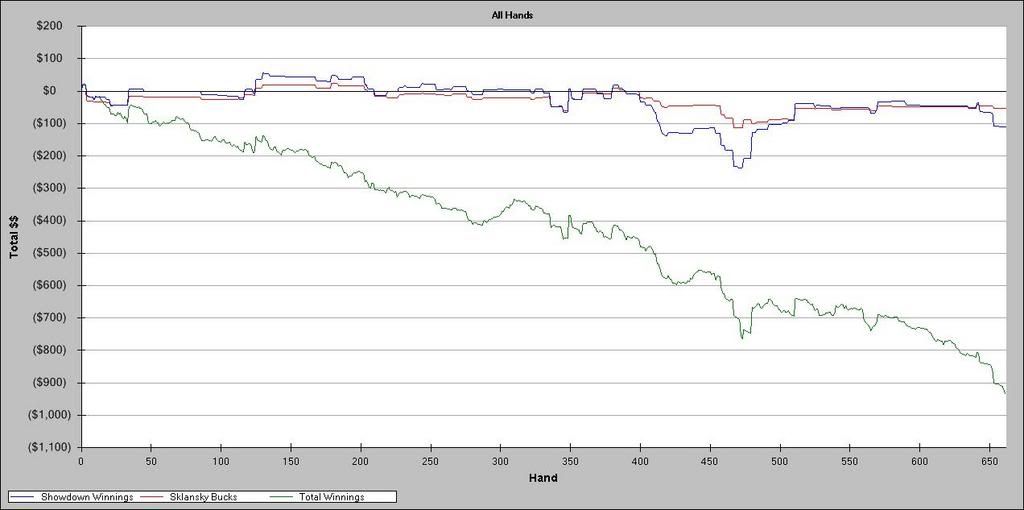
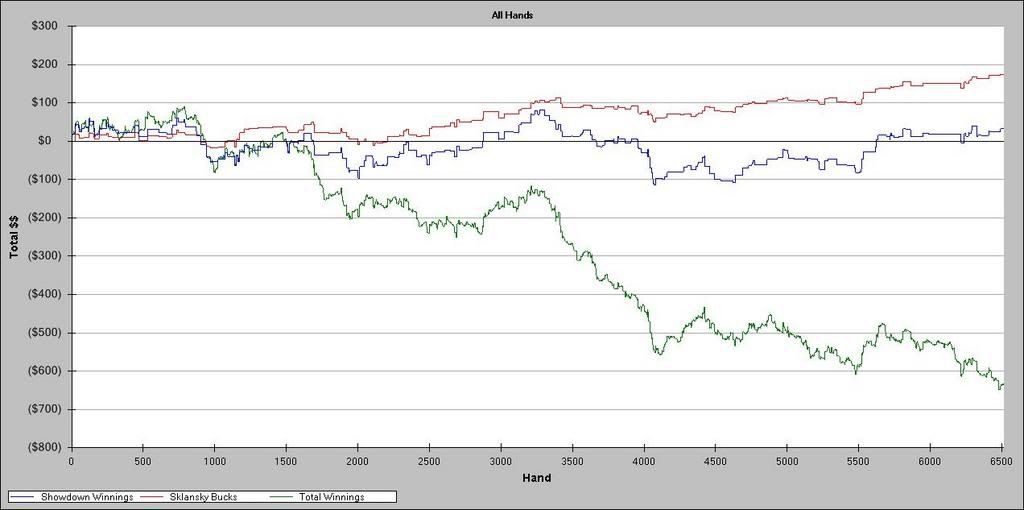
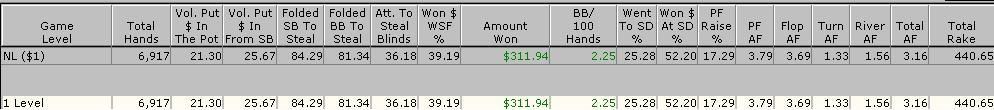
makes sense, while i played bad on the sample i had in the grapher, i also knew id run bad and was losing lots at showdown to suckouts etc ad all draws hitting, even with equity adjusted i was -2bbs/100 so i knew i was making errors.
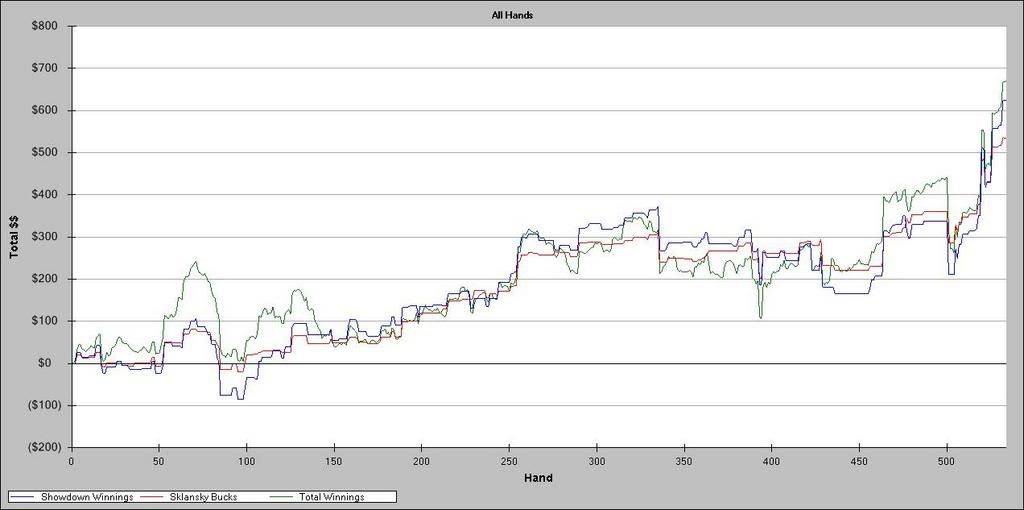
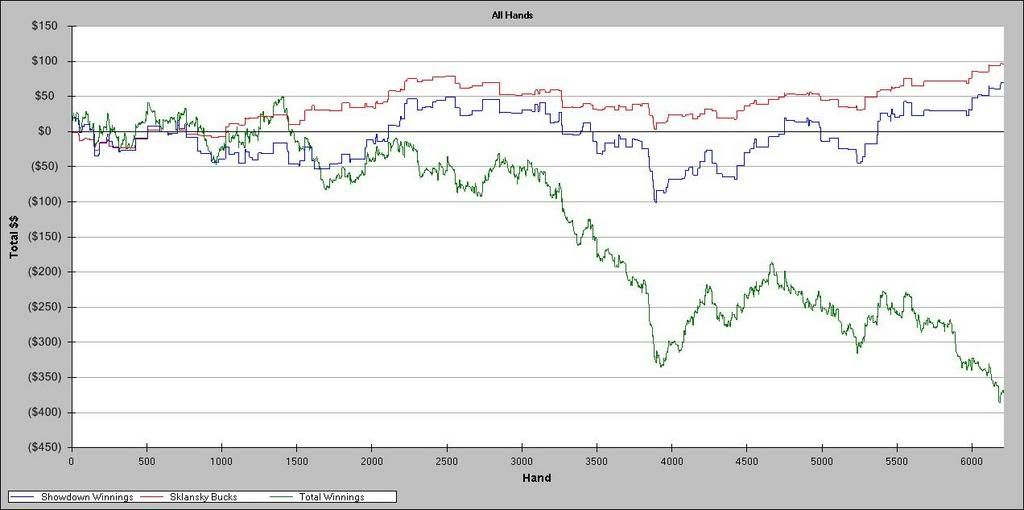
So much different now that the showdown line is closer and positive to the red/blue but still what i term a significant amount down.
Meh at least i have a rough idea now!
|


 Reply With Quote


